

- Rows are also known as records.
- Column are also called attributes and features.
- Transaction table means table which contains transaction data.
- Tableau is mostly used to analyse data using chart and give presentation using Dashboards.
- Other tools similar to Tableau which are used for data visualization are Power BI & QlikView
- Excel can’t support heavy data with large columns and rows and it will crash. So, we use these BI tools.
- self-practice is very important. use more different data set in practice.
- Duplicate as crosstab from right click will change to table in new sheet.
All Tableau Topics
Groups – manually grouping different items as desired (can be done both on measure and dimension)
Sets – will divide everything into two section – IN & OUT (Not Available for Measure)
Combined Set – Combine two or more sets
Union, Joins, Blends
Union – Rows Level Combination
Joins – Column Combining
Blends – To combine different type of data source
Parameters – can be used in filters, bins, reference lines, and calculated fields
Filters – Context Filter
Table Calculation
Formula Calculation / String Calculation
Calculation Field – IF & IIF
LOD – include, exclude,
Fixed – { FIXED [Customer ID]:MIN([Order Date])}
Dashboard
Dual Axis Chart
Histogram
Charts or Graphs
Functions – Windows Function / SQL
Mark Section
Toolbar
Cluster
Reference line/Band
Pages??
Actions – Filter Action: to filter in 2nd sheet based on action on first sheet
Hierarchy
Sets
Parameters
Actions
Calculated Fields
LOD
Table Calculations
Pivot Table
Charts
Joins & Blends
Filtering (& Sorting (Nested Sorting)
Data Pipeline
- Step 1 – Data Collection: Data getting collected at different stores of Star Buck.
- Step 2 – Data Storage: All the data will be stored in a database. The database resides in a Server which is always online (connected to the internet). A database can have different types of data tables such as transaction info tables, customer info tables, product info tables, etc.
- Step 3 – Data Extraction: A sample of the Data is pulled or extracted from the server into Tableau using SQL. It is called a sample of data because we don’t need whole data from the beginning of time, we may need only the last 5 years of data to get valuable & meaningful insight. If the data is clean, then pull it directly into Tableau. If the data is not clean, then clean the data using some data-cleaning software or programming.
- Step 4 – Data Cleaning: After downloading data, it may require pre-processing to remove null or erroneous, junk values if it is not clean or not structured. Not Clean means some data are missing somewhere or have incorrect values. Data is cleaned to get an accurate result in insight.
- Step 5 – Data Analysis/Visualization: Analyzing the clean data to get meaningful & valuable insights.
Types of Data Types in Tableau
1. Integer – Whole Number like Age – 26. (Hash – #)
2. Float/ Decimel – like Weight – 69.42 (Hash – #)
3. String/ Char – Name – “Rovin” (Abc)
4. Date/DateTime – 1-Jan-2022 12:00:04 (Shown as Calendar Icon)
5. Geographic Value – City, Country, Postal Code (Shown as Globe Icon)
6. Boolean – True/False, 1 and 0.
Dimension & Measure
Tableau divides all features/attributes/columns into dimension and measures automatically by putting a line of separation. Dimension/Measure can be changed also if it is wrongly assigned.
- Dimension – Can’t be aggregated, can’t be measured, no mathematical operation can be done.
- Measure – It is measureable and mathematical operation can be done such as MIN, MAX, MEAN, MEDIAN & SUM.
Examples
1+1 – Measure
India – Dimension
Points:
#All Numbers are not always measure, it can be dimension also sometimes such as Postal Code, Phone No.
#For some reason, Latitude and Longitude (Geographical Value) comes under Measure, not under Dimension.
Simple Process to Create Chart on Tableau
- Upload DataSet File in Tableau
- Drag the Desired Table into the Data Source Blank Canvas
- Go to Worksheet and Drag desired dimension and measure to column and rows.
- Experiment with Count, Sum, AVG, etc
- Further Change Colors and Chart Types to make chart attractive & gain valuable insight
Types of Charts
#Types of Chart from Tableau
https://www.tableau.com/data-insights/reference-library/visual-analytics/charts
1. Bar Chart – Easy to quickly highlight differences or comparison between categories, show trends, outliers (values at abnormal distance), find high & lows.
2. Line Chart – Connect several distinct data points to show continuous evolution in a line. Best to use for timeline/timestamp or trend data to be analysed or visualised in years, quarters, months, etc.
3. Pie Chart – Best to analyse the percentage or proportions of different data with relation to each other. Angle mark will only show in this type of chart. Use Pie Chart when the number of unique values in a dimension is small generally less than 10 (i.e.Region-NSEW 4 unique values, Category- 3 unique values), avoid it when the unique values in dimension is large(i.e. cities – 531 unique cities, so 531 pie slices which is bad.) Try to avoid Pie charts as much as possible (unwritten thumb rule) because in dynamic data from server or realtime, the data point may increase.
4. Scatter Plot – This chart is best to use for showing the relationship between two or more measures, and is particularly useful for identifying patterns and relationship between the two measures(pos, neg correlation), outliers. Good to analyse data deeply or individually as the individual data will be scattered as rings or dots. Scatterplot is good for charts with huge numbers like order id and not for regions which are only 4. It can show lots of information at the same time by adding lots of measure and dimension.
Scatterplot is Generally used when I want to see how all the data points in the given dataset is scattered between two measures(one on X and other on Y axis). Adding more dimensions in the COLOR, SHAPE, SIZE is extra information and it’s possible, however not always required based on the business need.
There are two ways to create Scatter Plot chart –
- First method, Put both measures into rows and columns and convert them from measure to dimension by selecting dimension from the dropdown. There is no need of any dimension, two measures are enough to create a scatter plot. When you convert measure to dimension, then the sum of values becomes individual values on the chart.
- Second method, (without converting to dimension), Scatterplot is created by dragging two measures into columns and rows, then dragging desired dimensions into details.
5. Heat map – This chart is best to use for displaying data in a matrix format, and is useful for showing patterns and trends across multiple dimensions.
6. Treemap – This chart is best to use for displaying hierarchical data, and is useful for showing the proportions of different data points within a larger category. We can see two different measures together in colors and sizes.
7. Highlight Chart – It highlights the values based on the aggregation or sum of the measure from dark to light colors. It can also be shown on treemap also.
8. Heatmap Chart – When Size is added to the highlight chart, it becomes a heatmap chart. Treemap can be also used in this. For visual charts like heatmap, don’t only see legends, also check marks to understand the chart.
9. Stacked Bar Chart – Things are stacked on top of each other. There are Horizontal & Vertical stack bar charts. Carefully observe the values in the stacked bar chart because a single bar has many values of their sub dimension within it.
10. Sparkline Chart – It shows absolute value in the line chart. Every single data will be shown for each date. Click on drop down near Year and change it to exact date.
11. Bubble chart – Bubble chart helps to see the data values in different colors, sizes but all will be in shape of bubbles. It is not like normal chart like others because it doesn’t have X, Y axis in the bubble chart. Main difference between Treemap and bubble chart is the shape of square/rectangle and bubbles respectively.
12. Area chart – This chart is best to use for showing trends over time or comparing data across categories. The 2nd dimension can be dragged into the color mark to analyse the 2nd dimension at the same time. Then it will look like a stretched stacked bar chart. Alternatively, line charts can be used for simplicity.
13. Side by Side Chart – There is no need to create two separate charts to analyse 2 different measures against one dimension. They both can be combined in a side by side chart, which are represented by different colored bars in the same chart. Minimum two measures and one dimension required for this chart.
14. Dual Axis Chart – Dual axis charts are the charts which are a combination of two different charts together. Two y axes will be created on both the right and left side of this chart and that’s why it is called the dual axis chart.
To create this chart, there should be two measures and one dimension for this chart. Click on the dual axis of any one of the measures from the drop down. It will start showing both charts’ values as a circle. It can be changed to any bar or line chart and color, size and opacity can be adjusted to merge both charts together in a nice visual way without overlapping data points on each other.
15. Tornado Chart – Need to Check How to Create Proper Tornado Chart
16. Table Chart – Will show data in table as in excel.
17. Donut Chart – There is no direct option to create Donut Chart on Tableau, but it can be done using some other methods.
18. Box and whisker –
it shows all value together such as min, max, median, 25% percentile, 75% percentile in one single bar in the chart.
Quick Important Points
#Every single row or record or dot is called a data point.
#One workbook for one visual chart. Dashboard for multiple visual charts
#Time Component – Trend, Year, Quarter, Date, Month, Day, etc
#Avoid horizontal bar chart for time chart
#Use the Swap option to change from vertical to horizontal chart and vice versa to view charts in different ways. It also interchanges the position of columns and rows to each other.
#Drag dimension/measure on color to create sub-division based on different colors within the existing chart without creating another bar or line.
#Right sidebar of Tableau is called Legend which helps to do chart formatting & understand the chart better if there are different colors or different sizes used in the chart.
#Click on Plus sign to change year dimension in column/row to quarter, then month. Directly can be done by selecting from drop down.
#Pull dimension/measure to the blank area below the mark to remove it from the chart.
#Measure Values – Why do we have it below mark? When we bring two different measures into the picture then measure values are shown separated below Marks. Consolidated measure values are shown on the side instead of populating it on the rows/column. Then drop it into measure values and not in rows/columns.
#Usually begin with putting dimension in column and measure in rows when you have no idea how to start.
#Click on Standard drop down to Entire view to zoom the Pie Chart. Sometimes, the size option can also be used to zoom the charts.
#To get the percentage, Click Sum drop down for the particular measure, then click Quick table calculation. click on percentage of total.
#Separate measure sections will be shown individually for each chart in the mark section for individual customization. Customization can be done on the All mark section to customise all charts together.
#By default, the measure will be shown as sum, we can change it later to avg, count, etc.
#Count(distinct) – It will only count unique customers. It will not count the same customer again. Similar to count unique in excel.
Marks Section in Tableau
#Detail Mark – creates sub categories in the main category with a little gap where sub categories can be seen by hovering. It is similar to a color mark just without colors.
#ToolTips Mark – When you add dimension or measure to the tooltips, it will show in the details when you hover the mouse over the data point.
how to show bar chart in the tool tip.
first we need to create bar chart in a sheet, then insert the sheet name in the tool tip.
Then you will be able to see sub categories value as bar – state wise in the tooltip when you hover on state.
We can do like this for any chart.
#Shape Mark – Will show values in different shapes for different dimensions. You can check legend to find which shape refers to what.
#Label – Dimension or measure value will show up on the data point without need of hovering when dragged on label mark. If it doesn’t show up, then tick on “Show mark label”. Drag the same measure to the label mark for which the chart is showing to avoid showing the wrong data label.Labels can be formatted by clicking on label mark, then click on three dots and add desired text before formula <>. Greyed-out will not be visible.
#Size – Usually small, medium, big sizes will be created according to the value on the data point.
#color – Different unique colors will be shown for similar types of value on data points in the chart..
#Chart Drop-down – Charts can be selected from the first Drop down in the mark if we are clear what chart to create in the beginning before dragging dimension and measure. It will show all the options related to that particular type of chart in the beginning before dragging.
Question to create chart and find answers
Q. Find Product Category that has Highest Sales for Most of the Years – (Bar Chart)
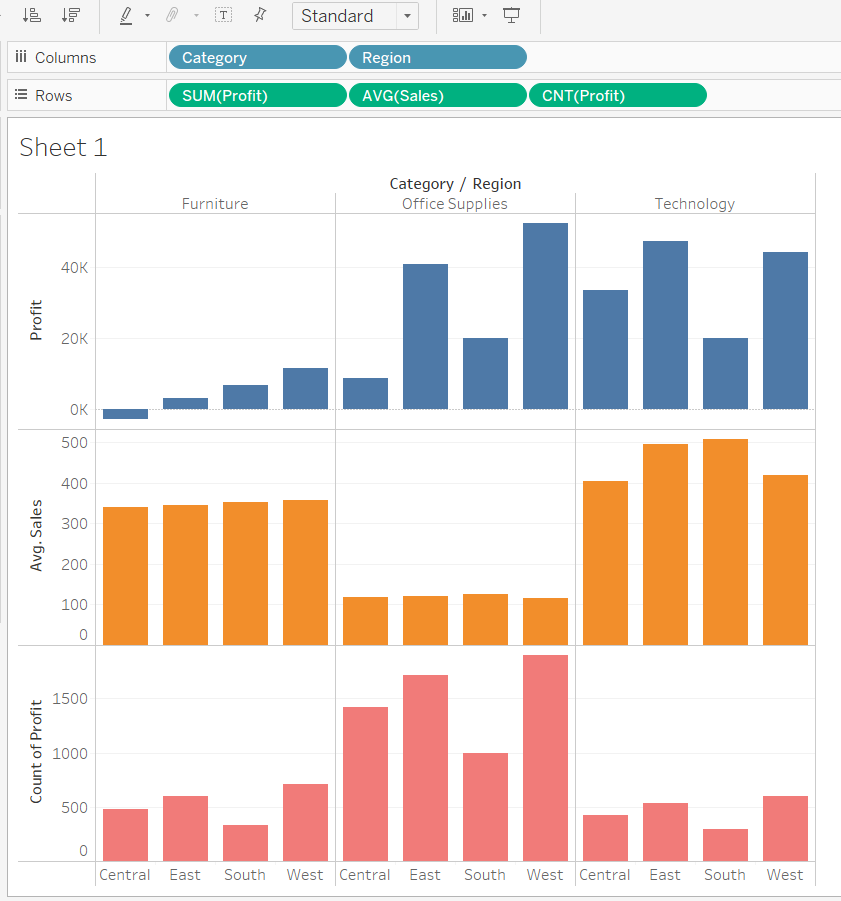
Q. Find Sales and Profit by Region – (Side By Side Bar Chart)
Q. Display sales for each subcategories by region for all the years in a table format – (Highlight Chart)
Q. Find subcategory that has the highest sales and highest profit – (TreeMap)
Q. Display the total sales of each category by region. – (Stacked Bar Chart)
Q. Create a chart to analyse the trend in Profit, sales and discount in a single view. – (Sparkline Chart)
Q. Find an order id that has highest sales and highest profit values.- (Scatterplot)
Q. Create an area chart which displays the total number of quantities sold and mode of shipping for each month (Area Chart)
Q. Find which sub category had the highest discount value. (TreeMap)
Q. Find the most common quantities that are purchased in most transactions. (Can also be written as: What quantity do people most often buy?) (Bin Conversion)
Q. Find Total Transaction in Each Region and Find total customers in each region (Count Distinct)
Q. Compare Sales and profit for each category in a single plot. (Blended or Combined Axis / Side by Side Chart)
Q. Find a sub category that has the lowest discount but highest profit. (Dual Axis)
Difference Between Discrete & Continuous?
- Discrete means the whole number. Example – count of phones sold. Phones sold are definite count no. which will not change. Also there will not be any decimal number such as 4.44.
- Continuous means it has infinite possibilities or continuous values which cannot be fixed such as age. Age can be 30, 30.5, (30 years, 6 months, 7 days). It keeps on continuing and doesn’t stay fixed.
- Continuous is common in charts with time, mostly line charts. Continuous charts will be connected with each other in a flow with continuous value. It will be connected with a line.
- If it is something like discrete, then ideally it won’t be connected. It is good to be used in bar charts. There is no need for a time component in a discrete value chart. There is no connection between discrete values in the bar chart.
- By default, all the formats will be in continuous value format. When values are converted into discrete, then it will show as a whole number with distinct values. All get separated.
- Discrete will show dimension/measure in row/column in Blue color and Continuous will show in Green Color.
Types of Sorting
1.Data Source Sorting: In the data source section, click on three bars on the heading of the column and it will sort in ascending or descending order. It is called sorting at data source level.
2. Alphabetic Sorting: It sorts dimensions alphabetically.
3. Bar Sorting: Click on drop down of dimension (sorting option is not available on measure) and select sort. Choose “Field” in sort by, then choose ascending or descending order from the dialogue box.
Field Name – Choose the field name for whose measure value you want to sort. Ideally, you can select the measure that is on the chart.
Aggregation – After selecting the field name, select the type of aggregation you want for the value to be sorted by. Dimensions will show aggregation such as count, min, max, count distinct. Measures will have more aggregation such as sum, avg, median, percentile, etc.
4. Manual sorting – Sort bar according to my desire.
5. Nested sorting – Region > Category>Sub-category in rows. Profit sum in Mark. Table will come up. Then all subtotals will show for each category and region.
From menu bar, Click Analysis >Total > Add All subtotals
Select sub-category and use nested sorting.
Innermost (sub-category) will get sorted. Category is not sorted.
We need to use nested sorting from category to sort category.
Nested sorting is useful for different types of sorting within tables. It is also useful to sort different chart categories separately in the same chart.
#Sorting icon option is also available on the above quick bar.
Bin – Histogram
Bin is used to create Histogram Chart. It divides the numerical data in equal range set by us and show equal ranges as a bar in Histogram Chart. It can be useful in situation like which quantity was the most frequent quantity in all orders.
Another use case can be if there are thousands of product and if we want to know the count of products between 1 to 100 price, then bin and histogram will be useful.
Histogram is like a bar chart, where we count different dimension/measure.
Y-Axis is always count.
Why use Bin ?
- To fit in a view for lots of values.
- No, We would like to know in range.
Drag sales to column and click on histogram from legend. Automatically bin will be created which can be edited later to increase or decrease the bin size.
********************************************
Suppose there are 1000 data point and I create 100 bin size, it will show 10 equal bar of 100 size.
But what If I create bin size of 99, then all bar will not be equal , because last bar will be show 99, 99,…99, 10 range, (10 in the last bar) right ?
so it is important to put bin size which can equally divide will total for equal bars.
Solving Question Using Bin
Q. Find the most common quantities that are purchased in most transactions.
What quantity do people most often buy?
In Statistics, probability, You will learn about distribution.
We can use bar charts. But If we use 100 thousands bars for millions of quantities, then the chart will not look good or fit.
Bins the quantity
group the quantity into 10 bins of equal range.
100,000 values – create 5 bins.
All bins will be divided into values of each 20000 bins with 5 bars.
Bin is like a group.
We have to create a bin because we are using measure.
We have to create bin
Click on create then bin from drop down of measure.
A dialogue box will open. Size of the bin is 1.77, what it means.
What tableau has done is, it has tried to suggest that each bin can between 1 to 1.77.
A new measure will be listed into dimension with bin in bracket.
Tableau Questions for Practice
- How many orders were shipped on the same day?
- From each region which is the customer with the highest sale ?
- Which is the city with highest profit ?
- What is the average discount for California?
- What is the minimum total profit in the top 10 sub categories?
- Which product has the highest profit in the bottom 10?
- Which is the most bought product in each region?
- Which is the most bought product?
- Which customer has the highest average sale in the bottom 10?
- which city has highest no. of transaction in each region?
- Which pin code has lowest average profit in top 10?
Data Filtering
Filter the Data
If there are 3 countries and I want to see only 1 country of my desire, then I will use filter to filter out other 2 countries.
Dimension Filtering – when we filter dimension i.e. country – India
Measure Filtering – when we filter measure such as sales more than 18
Which are matching the condition that we have put will be shown.
Types of Filtering
1. Extract Filter – (only available on Tableau Desktop)
Connect the data to Tableau – Live and Extract.
Public – only Extract is available.
2. Data Source Filter
3. Context Filter
4. Dimension Filter
5. Measure Filter
6. Table Calculation
7. Interactive Filter
8. Date Filter
What is Live & Extract?
As soon as a new data is created and stored, Tableau will update and show in visualization chart in real time.
For this, Tableau has to be connected to live database, then only new transactions or data is updated in the Tableau chart. It is like a live telecast or live feed. It is also called dynamic data.
*********************************
What is Extract?
We extract data up until a certain time period. Static data. Live data or realtime data is not extracted.
Example data extracted till 7:10 pm.
Extracted data can get updated if it is manually updated. Other way to update extracted data is by refreshing the data by clicking on refresh on Tableau Desktop. It will still remain static data, if live data option is not selected. Data can be updated automatically by setting when to refresh, like every hour or every day.
*************************
Data source filter – Click on Add,
select column where you want to filter out, select rows what you want to see and deselect what you don’t want to see.
example, selecting central region only from region column.
dimension filter
drop sub category on filter
show filter, it will show in legend
custom value list
1000 values to filter manually individual is pain, type label and all labels containin g word will come
use all is same as all select from list
wild card
sometime you may not know
contains
starts with’
ends with
exactly maths
**************
condition
filter category based on sale
by field
<> – not equal to 1000
**************
top
top/bottom
select top five
based on sum of sales
********************************************
Find the top 10 states based on based on region?
Add to Context: If we want to see top 5 based on the region select from filter, then we need to use Add to Context option from region.
Normally, when we select top 5 and select one region. It will only show region which are in the top 5 combined.
In this case, we will see top 5, not from overall region, but from selected region only.
First, India only will be taken for table and then top 5 will be checked in India’s data and shown on table.
**************************
Context Filter –
Context Filter
Select everything selection
Add on, Include everything in the selected filter.
If we want to see top 5 sales in specific sub categories, then context filter is useful. Otherwise, we will only see top 5 sales from the all sub categories and not from specific sub-categories.
**********************
Running Total – Cumulative Total (It is helpful to see when the desired total reached.)
Triangle shape means filter is applied.
Filter Check box can be converted to slider.
Discrete shows table from bar to table and shows number value.
How to reduce decimals?
Go to format, go to numbers and select custom to 2.
Types of Show Filter for Dimension-
1. Single Radio Button – can choose only one value
2. Drop down – can only choose one value and used to save space on dashboard
3. Drop down and checkbox – checkbox is hidden in drop down which allows to select multiple value for filter.
4. type the filter to add
For measure, slider type of filter is best.
Table calculation filter
Tableau apply filter in this order priority: ED-CD-MT
Extract
Data source filter
context
(Fixed)
dimension
Interactive filter – (Include/Exclude)
measure
table calculation
Interactive filter – when we select or drag to select and choose keep only or exclude option from the chart it shows only show or hide those values from the chart. This filter will be automatically created in filter section.
Cascading filter
only relevant value – when you click on this, then you will only see values to filter which is relevant to other filter selected.
It will not showing any unnecessary value to filter, which does not affect the chart.
#Order(Rank) of filters in filter section also matters. Its like heading, sub heading, their sub heading, etc.
#Wildcard is only available for dimension,
#Tableau Public – Extract only
Tableau Dekstop – Live and extract
#Pulling data from a table only until a certain time period is called Extract.
********
Hierarchy of Filter
extract, data source, context, fixed, dimension, include/ exclude, measure, calculation,
Combined Axis / Blended Axis V/s Dual Axis Chart
Combined Axis / Blended Axis
Drop the value on Y axis to see measure together on single axis. (Can we drag on x axis?)
Dual axis will show y axis on both left and right side.
Combined axis will show only one y-axis on one side i.e. left side.
Dual axis will show different two y axis, but the chart can’t be compared with each other for same value, combined axis can be used for same value comparison.
Alias, Grouping & Hierarchy
Alias:
Change the value to another name.
Click on the drop down of the dimension(not available for measure) and click on alias, enter desired alias in the alias section and value will be changed.
Grouping:
US, USA, United States, United States of America – All are same so we will group them.
We can also use grouping to put category such as stationary for sharpener & pencil to analyse them together as an individual.
click on Create group from dimension dropdown, select what you want to put in group and give customized name if desired.
It will create a new dimension which is grouped along with original dimension.
You can create more than one group in a single dimension.
**********************
Grouping measure is similar to bin.
But it will show manually what we have added to the group.
Bin sizes are supposed to be even or equal sizes.
But when we group, it is necessary to be equal because we are grouping measure like we want.
***********************************************************
Hierarchy
Country>State>City>Area
Category>Subcategory>ProductName
This is a hierarchy because the order cannot be changed to upside down.
Date Hierarchy
Year>Quarter>Month>Date>
Plus sign will show for dimension with hierarchy.
Plus will not show for last item in hierarchy.
Custom Hierarchy
Drag sub category and drop on category
New hierarchy symbol will be created and a dropdown will come to expand or minimum. It can also be renamed such as product hierarchy
Bring it to the column, top level hierarchy is category. click on plus sign and subcategory will come, then again click on plus and it will show product name.
Remove from hierarchy by just dragging outside of the hierarchy.
Once dropped inside, the hierarchy order can also be changed later.
#You can’t create hierarchy for mesure and it works only for dimension.
Aggregation & Granularity
Aggregation – overall sales of all types of product
Granularity – show only details of single product. One of the best example is scatterplot chart.
row level calculation – calculating every row
*******
aggregation calculation – calculating aggregation (total/last row)
example – sum ([quantity])
******************
row level – cost = sales minus profit, aggregate level
**************
Aggregation level calculation
Percentage of overall category or sub category should include sum at formula level.
If the sum is not included, then it will add all the percentage in every row which will be very high and incorrect value.
Table of Calculation
#Running total is best used for time component. Then only the relation can be created and make sense.
Outlier
Formula
Count and Count Distinct Formula can be used together on same dimension to find if there is any duplicate entry or not.
******************
Data type fn
***********
*************
String function –
profit as string
str – means it is a string
Type – STR(Profit), Click OK.
You will get profit(numeric as string)
It can be used to correct the data type which is wrongly assigned data type.
************
T|F – symbol for True and False Calculated Field
Quantity>10 in calculation field.
True and false will come in the chart.
quantity will show as true and false. It can also be used to filter out in the legend.
It is a condition and until a data is applied, no value will be shown. It is like a formula.
**********************
Split first and second name-
split(string,delimiter,token number)
delimiter can be any character. it is a point when the column will split. common delimiter are full stop, comma, etc.
Split(Customer Name,” “,1)
token number mean which column we want.
It will show the first name, second name, whichever you want.
****************
Trim
Aaron Paul – we can remove the space between names using trim
Trim(string)
example –
Trim(Name)
*********************
Left(string,num_chars) – pull these many characters from the left.
*******
similary use RIGHT
**************
To join characters before or after column value.
‘sir’ + name
*****************
LEN, LTRIM, RTRIM, TRIM, CONTAINS, MID, REPLACE
**************
All function formula can b seen using arrow function.
********
#How to put double condition – min and max value in the formula?
hi I found difference betwen if and iif:Tablue Interview Q:
Firstly, a standard IF statement. More verbose than the IIF function
IF test THEN action when test is true ELSE action when test is not true END
IIF is also known as the Immediate If. It’s a shorter way to write a simple IF statement. For more complex IF statements, especially if nesting or needing a form of ELSEIF, use the standard IF statement above.
This is similar to an Excel IF statement and I have observed those coming from Excel
**************
Try to Find Difference between IF vs IIF
IIF(test,then,else,[unknown])
example –
IIF([Region] = “South”)
Sets
Sets:
Sets are custom fields that keeps subsets of data.
Create a set of transaction greater than 10 sales.
Whatever is included is called IN and what is excluded is called OUT.
Sets are binary which is reperesent by IN & OUT.
Static Set – Manually decide which are IN and OUT.
Dynamic Set – Based on condition, sets are created.
Q. Create a set of customers with highest profit (top 5 manually)
Based on
click on double circle and click on crete set. Name the set
set will be created.
New dimension will be created after creating the manual set.
New manual dimension can be dropped in the c olor section and to see top 5 manual set differently.
*****************
When the data is updated, these top 5 manually seelected customer will not be top 5 customers always. It may change.
Dynamic Set –
Q. top 10 subcategories based on sales – dynamic set
We can manually selected it, after doing ascending on the chart.
Now to create dynamic, click on set.
Put the condition of top 10 in the By field. Then put sum of sales, top 10.
New Dynamic set will be created as dimension in the list
Once you droop in the color, all the top 10 will be colored and seen separatley.
We cant know the difference between static and dynamic data, then the data is not getting updated.
In and out will also be seen in the legend section for color reference.
We can also put, sale more than 10,000. and many such conditions like that.
****************************
Q. Customer/ Transaction with high sale and low profit.
2 conditions to be applied
It is called combined sets.
Create two set
1. high sale customer set
2. low profit customer set
both sets can be seen in dimension.
Put in rows both sets and customer name, you can see that sean miller in for both rows.
How to combine two sets ?
click on any already create set>create combine set>
then update both sets in it.
Then select shared member in both sets to see only intersected or common data value.
Type of combined set –
1. Union – Select all – common and uncommon both included
2. Intersection – only common, no uncommon is shown.
3. A-B – It means that A data will be completely shown except what is common in B. –
Only High sales without low profit.
4. B Minus A – only low profit excluding high sales.
New combined set will be created in dimension list.
drop it also in rows to see only that customer.
********************
Set V/s Groups
1. set can be both static and dynamic, but groups are always static.
2. Sets are binary i.e. either IN or OUT. Groups are not binary, because any number of group can be created in the same group dimension. In one set dimension, we can get only one set. In one group dimension, one can create any number of groups.
3. Sets can be created only on dimension, but groups can be created on both dimension as well as measure.
4.
Parameters
It helps to change values in the filter/sets.
Dropdown option near search, click on create parameter.
Give a name to parameter – top n customers
data type – integer
We don’t need to select top 10, 20 or 50 customer by editing the sets.
We can use slider.
New thing will be created at the bottom called Parameters and new top n customer paratemer will be seen here.
Click on show paratmer and it will show on legend.
In the top 10 section, we don’t need to enter any number such a 10 or 30. We can directly select top n customer parameter.
Now we can easily enter the value we like in the paramenter in the legend.
We can use parameters to easily update top or bottom conditions.
It can also be used along with formula, (it will be explained later)
Calculated Field
What is Calculated Field?
Help in creating new column based on new mathematical operations using existing columns.
Q. How many days took to ship the order after placing order?
Calculated field
type ship date and a drop down will come while typing
Shiping date minus order date
[Ship Date] – [Order Date]
New measure is created in the list.
New column for this (along with bins), will also be created at the data source level but no change will happen to actual raw data.
Q. on an average how long it takes to ship an order.
Select Calculation field from drop down.
we can use calculation field for many reasons to find out things such as :
sale – profit = cost
order date – ship date = time taken to ship
*********************************
help to create new data with the help of existing data
Excel file or raw file don’t get modified. but we can see the modification the data source level with extra columns.
4 basic components in calculation.
1. Function
example:
cost = sales – profit
2. Field
what could be used to calculate data – dimension and measure.
3. operators (Arithmetic Operators)
it is symbols that denotes what kind of operation that you are doing.
a. Arithmetic operators +,-,*,/, – , %
plus, minus, divide, multiply
b. comparison operator
sales>=profit
>,<,=,<>,><
== – if two fields being compared are same as last month.
>= one field is greater or equal to another
<> (!=) – to find what are not equal.
**********
logical operator
AND,OR,NOT
1 AND 1 = TRUE
1 AND 0 = FALSE
0 AND 1 = FALSE
0 AND 0 = TRUE
AND – satisfy both condition.
OR – one condition is enough
NOT – reverse condition
And example – both condition needs to be satisfy
(10>8) and (4==4)
True (1) and true (1)
1*1 = True (1)
And :- Both condition should be true
OR:- One condition should be true.
NOT:- Condition should be false
NOT (>39) – means it should not be more than 39.
Actions
What is Actions?
Action is to do something on a view to get some action out of it.
Worksheet Menu>Action
Types of Action–
1. Filter Action – Apply filter from one worksheet to also another worksheet.
Just by selecting one category, only data of that category will show in next wheet.
Highlight Action –
Hover – Going to another sheet, just by hovering to a category
Menu – Action will happen when clicked on the link on tool tip.
*****************
Go to URL Action –
hyperlink
You can open www.website.com/<our category>
We can open the webpage related to the category on what we click on bar.
**********************
Go to sheet –
move to another sheet
by clicking on bar, you go to another worksheet.
***************************
Change Parameter –
Parameter value will be updated wherever applied by doing the action such as clicking, hovering, menu action.
Value will go back to previous value when selected if the value is set to 1.
Another option is keep current value.
*************************
Action
Action is nothing, but reaction to some event.
Generally, the event here is click event. When you click a bar, you will see some change of another visual or some kind result.
It could be highlight, filter, url, update the parameter or change set.
******************
It interacts between two worksheet.
******
Highlight Action
Click on Add action, then highlight.
Select source and target sheet.
Select action, and
***********
Worksheet>Action
Filter action
fitler out only that data which is selected.
When 1st sheet is clicked with category, then 2nd sheet show that subcategory of that category only.
We can also add more than 1 action to see different action on different sheets.
************
Go to sheet
take action from one sheet to another.
*************
Go to url action
We put the term in the url and when actin is taken, we go to the related url of the term. The url can be wikipedia, google, etc wherever we can put the relevant term from the chart.
It will show like – “<Category>” in the action dialouge box.
Click on the hyperlink, after the action is done such as clicking.
******************
Parameters Action
Parameters Action works a a filter. It can change the value in the parameter based on our action.
It can be used to changed the visual or table from the legend by changing the value.
Wherever parameter is connected, it will be updated on all sheet.
***************
Set Action
Change set values
select source sheet
select set
Choose one of the three action option (What to do when clicked)
Assign values to set
add values
remove values
modify set by clicking on visuals bar
*****************
LOD – Level of Details
Find percentage of the contribution of each sub category to the total of each category.
{FIXED [Category]:sum[sale]}
Then it will show total of each category in the column and not grand total of all category.
Fixed will always remain fixed, not matter how many column are added.
to get answer – Sum sale / sum fixed cat sale
you can’t do sum sale/ fixed cat sale
Tabelau will show error that it cannot mix aggregate and non-aggregate together in formula.
*****
Understad the AVG purchasing power of the customer to setup a store in area where people are spending more.
Divide into high class, middle class, or low class by their spending amount.
**************
include (cust name): sum (sale)
It will also include customer name with the sale amount.
It helps to get average only on unique/distinct customers. Repeated transaction of customers will not be counted. no duplicate cust will not increase count to calculate avg.
counting only distinct when added with include
******************************
Exclude
Find the sale for each categroy, subcategory, by region and also exclude region in a single view.
formula – exclude region: sum sales
It will exclude the dimension which we mention and show the total for the latest dimension except excluded dimension.
It may look similar to fixed but fixed will never change, but exclude will change according to the nearest dimension in the column table.
********************
Include – if there are 3 dimension, include 4th.
Exclude – if there are 3 dimension, then exclude 4th. (Even if you add the excluded dimension, then it will act as if the dimension is not added.)
It can be used for comparison or new calculation.
we can include more than 1 dimension. It will work as iff it is already added in the view for total sale.
**************
Static or Constant value for Fixed
Include and exclude are dynamic
Table Calculation
#difference from-
how much difference from previous value
# % difference from
# % from
# Percent of total
# Rank
# Percentile – comparing with top mark
# running total – increasing total.
# Moving calculation
Moving average combine two previous value. We can select upto how many previous should be taken for average.
moving sum, moving max can also be created.
****************
q. which year did each category had the highest and the lowest sale %.
***************
compute using –
#table across – by default calculation for rows. left to right.
#table down – calculation of the column. up to down.
#Table –
**********
Pane – when there is a table within cell, it is called pane.
Cell – It shows single value.
Table – All cells included is called table.
Table,pane,cell – combined called scope. means area for calculation
Normally, we can say – What is the scope of calculation? means how many cells, pane are there in table.
we can choose pane wise calculation from whole table
**************
Across
Down
Across Down – calculation horizontally, then one down, then again horizontal calculation
Down Across – first column calculation to down, then one right across, then second column calculation from up to down.
table across and down – continuous value to right, then continue again from left to right in second row and so on.
Table down then across – up to down calculation, then second row continuous calculation up to down without starting from 1.
**************
Pane across – 1 starting
************
1 table is like 1 pane.
**********
#Add secondary calculation – nested table calculation
#nested calculation means calculation on calculation.
***********************
Table Calculation
rank, running total, difference,
nested calculation
pane, table, cell
across,down,across down, down across
Relationship, Union, Join & Blend
Click Here – https://machinelearningdata.science/tableau-union-joins-blend/
Map – Longitude & Latitude
Longitude in column
latitude in rows
Edit Location – select country
Add Marks Layer – we can add more dimension in the same map like profit in color and sales in size on same map.
********************
Map menu > map background –
we can use this to change the background of the map.
Esplore – map menu
We can also search the name of the places in the search option on the map.
***************
Group the state on map
select the state and select grouop. then it will show in different color.
*****************
To see states filled with different colors rather than dots, we need to select map from the drop down of mark section
******************
How did you put longitude and latitude automatically in the column/row shelf?
Doube click on any geological location such as pincode, states, country, city, etc and it will automatically show map without dragging longitude and latitude to rows and column. Its like a shortcut to create map chart.
Dashboards
Dashboard – for holistic view
funnel – pipe symbol
ignore action – it will not change in the dashboard when something is selected.
two ways to add chart – floating and tiled
***********
download option – download the image of dashboard as pdf
************
Create interactive dashboards and upload on tableau
********
showme more 2 plugins
use different chart
sakney diagram
***
add on chart plugin etension
*****
ask data – not available in tableau public
***************************
Tips for Dashboards
Key Takeaways from the Tableau Dashboard Session:
1. Maintain readability by using contrasting colors (light on dark and vice versa).
2. Choose colors carefully for better presentation.
3. Keep chart titles concise (2-3 words) and descriptive of chart content.
4. Enhance interactivity with action filters.
5. Properly position and angle labels.
6. Use color meaningfully and with a reference.
7. Efficiently use all available space without cluttering.
8. Sort data for easier understanding.
9. Minimize scrolling by fitting data within the space.
10. Utilize available dashboard templates.
11. Use clear and descriptive navigation buttons.
12. Apply context filters.
13. Use horizontal bar charts for displaying larger names.
14. Use unique datasets for unique dashboards.
15. Keep labels concise and avoid cluttering in small spaces.
16. Plan your dashboard before creating it.
17. Continuously improve dashboard presentation skills.
18. Group related charts together in the dashboard.
19. Keep dashboards readable and organized, using navigation buttons for additional charts if necessary.
Homework:
1. Learn how to add background images to the dashboard, with appropriate dimension.
2.Create static maps on the dashboard that cannot be moved.
************************
***********************
Tableau Dashboard
1. Title size should be bigger than chart title size.
2. Font and size should be same for all charts.
3. Similar size of the boxes in chart
https://datacrunchcorp.com/what-makes-a-good-dashboard/
Sales Dashboard
1. Sale by Region
2. Sale by State
3. Sale and Profit Relationship
4. Sale Category
5.
Dashboard Link:
Data Story
Data Story – showing multiple dashboard or visual chart with proper relevant heading
Pivot in Tableau
Select column using shift.
Then right click on any selected column and choose Pivot.
Then update the heading of both new Pivot columns
***************
It will show the summary of all the columns together as sum or count, etc.
Data Interpreter
Data interpreter helps to clean the data to some extent but not completely.
It will not show, when the data is clean.
It will show new table in the list. The new table will have original name from where the portion of table is taken along with cell name range.
Also, data interpreter can make mistake such as taking all the value in a row as heading, it might not be a heading. The heading may be above that value.
It is difficult to fix it in Tableau. But it can be edited in the raw data.
if you click on review the data – it shows what tableau has done or how it works.
what is header, what is data and what is ignored in the table will be shown by color.
Tableau is not a dedicated data cleaning software. it is not built for that purpose. It is just an additional feature for simple data cleaning tasks.
Reference Line / Band / Distribution
Reference line –
It is like setting a straght line for some value like $1000 goal. You can see that if you can achieve that goal or when you have achieved it.
Like a Target Line
Go to analytics and select reference line –
select line from top option.
select entire table for scope
select sum of sales then average of total.
you can also select constant or total to create a constatnt line or total line.
it is helpful to see which bar is achieving the target or crossing it.
when select constant, you need to put value for line.
********
you can also see avg for each pane or each subcat in the the view by selecting pane option for scope.
***********
Reference band –
upper line and lower line.
It is like a range of value in the chart.
***********
Reference Distribution
you can put like dynamic band such as putting 80% to 60% band depending on the value.
Trend Line / Forecast / Cluster
How to get trendline in Tableau ?
Select trend line from analytics under model and drop it on linear on the chart view.
****************
Linear – straight line
polynomial – more than 1 curve or 1 bend
exponential – one bend or one curve on the line.
************
Forecast
it helps to predict future
it show two indicator – actual and estimate
line based on real value
estimation line of forecasting.
it show future data, based on past trend or value.
only for continuous, it will happen.
***********
Cluster
Clustering helps to group data based on character of the data.
Mostly used for 3 dimension – like sale, profit, age.
similar character are grouped.
clustering needs two measure and one dimension atleast.
drop the clustering on view.
It will create groups of similar character.
You can increase the number of cluster by changing from automatic to numeric value like 5 or 3.
Pages
Page can be used to see or focus only on one value for one sub cat among many sub category.
data point can be shown and moved, which can play as well.
Attribute
Attribute is used on formula, mostly for dimension.
attribute is useful for ??