

In Tableau, a relationship is a link between two or more tables based on a common field, or set of fields. These relationships allow Tableau to combine and analyze data from multiple tables as if they were a single table. Relationships can be established between tables using a join, which combines rows from two or more tables based on a common field, or a blending, which allows Tableau to combine data from multiple data sources without actually merging the data. Relationships in Tableau are used to improve performance, and to enable advanced analysis, such as creating calculated fields and grouping data.
There are 4 different methods to connect one table to another table in Tableau:
Relationship within same file with multiple tables in Tableau is created by dragging the first table to canvas and then dragging the second table next (to the right side) to the first table on the canvas (no need of double clicking).
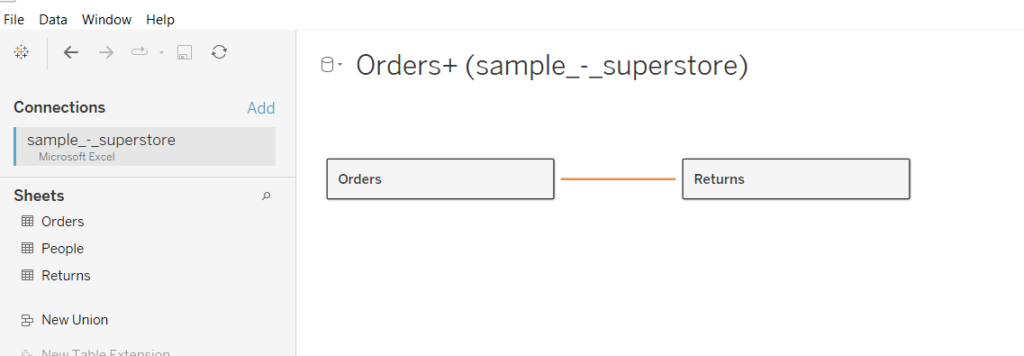
This will show the fields from both tables together in the Tableau worksheet. It is useful for combined calculation and creating combined charts. To create this type of relationship, both tables/sheets must be in the same file (raw data source).
Automatically Creating Relationships
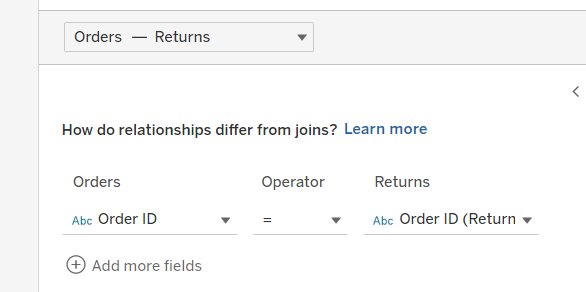
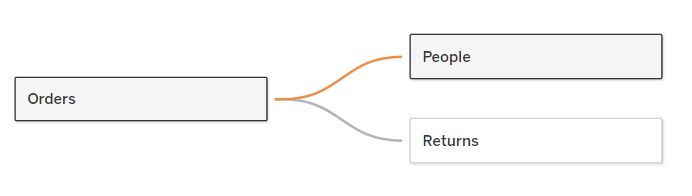
Tableau automatically tries to create a relationship (combine table) between two sheets by trying to find a same or similar column heading with same data type. For example, “Order ID” with “Order ID (Return)”. It will use the connecting field as the base for any further combined chart and calculation. If there is no connecting column, then no relationship will be formed and table will not be connected.
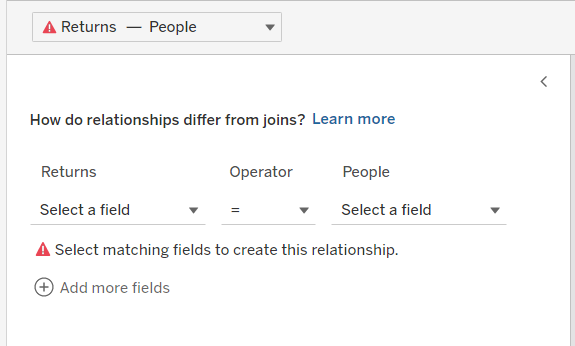
Manually Creating Relationships
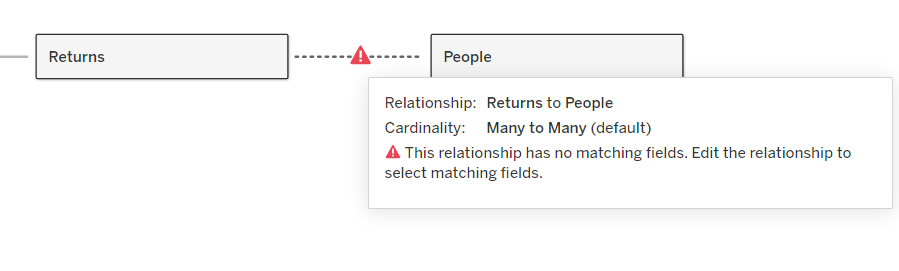
In case, if you try to connect two sheets with no common column heading, then it will show an error (cannot combine table). You may manually edit & create a relationship. You will need to select one column heading from each table which you think should be matched or connected. The connecting fields must have same data type.
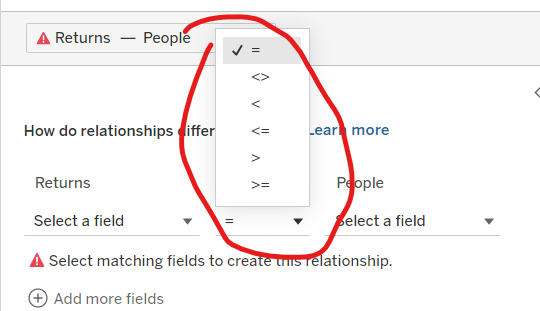
Operators in Relationships
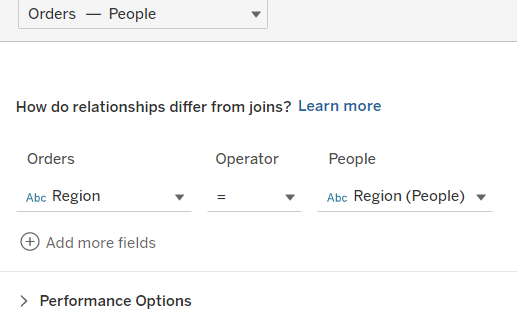
Different operators can also be used while creating a relationship between two heading such as not equal, greater than, lower than, etc. These operators will be more useful for measures such as quantity, profit, sales. By default, it will show equal to sign “=”.
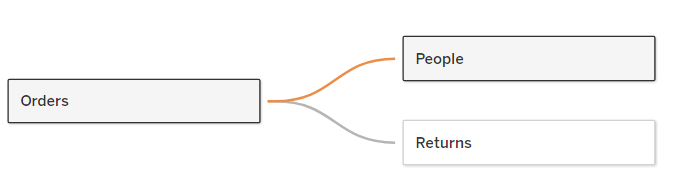
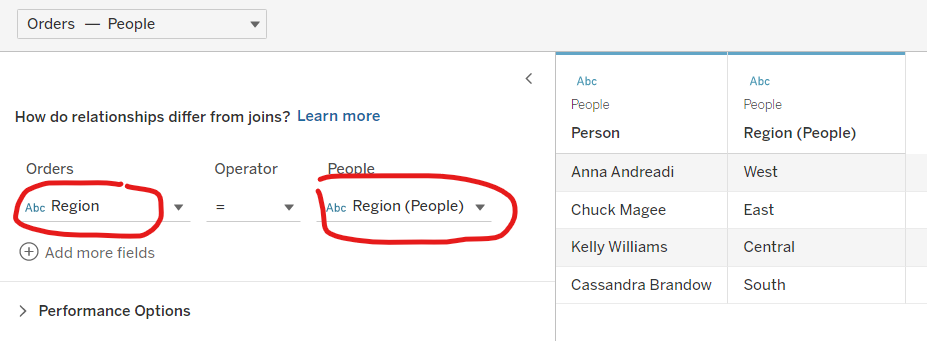
Multiple Relationships
Multiple relationships can be created between 2 or more tables, only if they have one common heading. In the example, the common connecting heading changed from “Order ID” to “Region” because there is no “Order ID” column in the people table.
Edit Relationships
Click on connecting line and change the relationship from below.
Swap, Remove, & Move Table
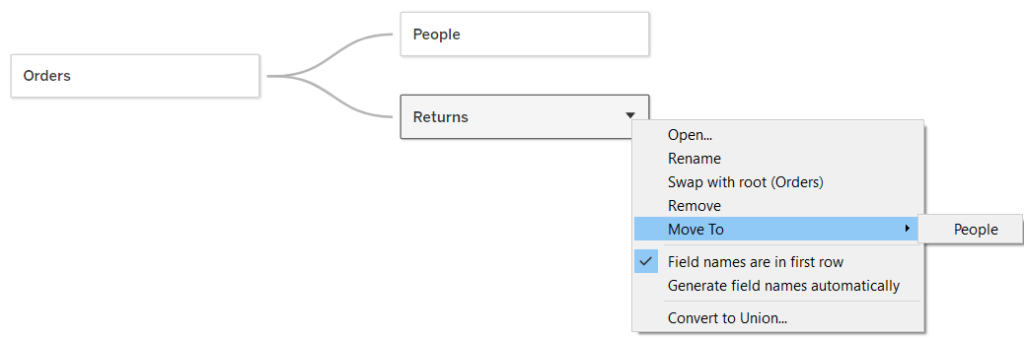
Swap with Root Table
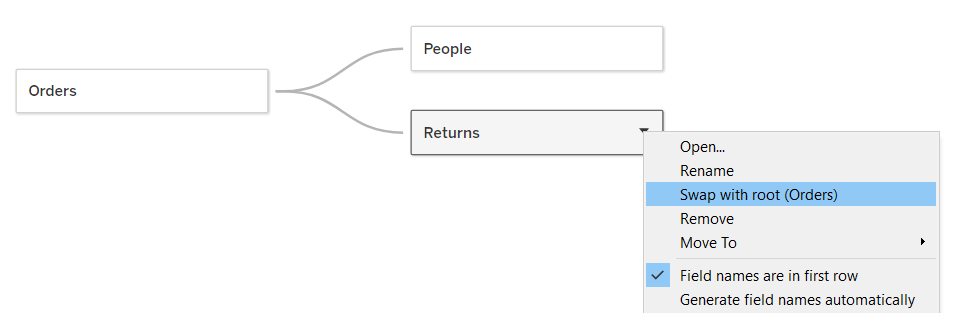
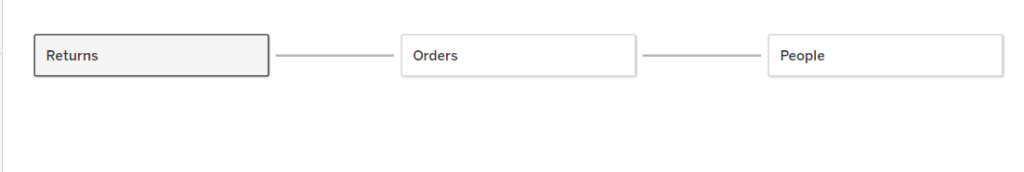
Root table will be swapped by click on “Swap with root (Orders)”. In below example, Return table has replaced Orders table and has become the root table.
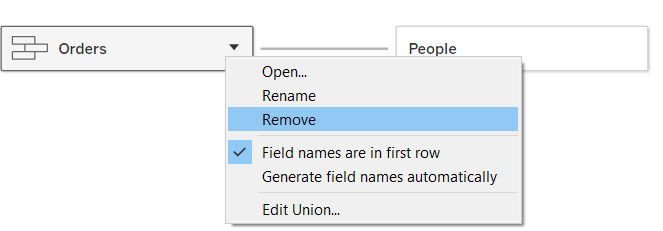
Remove Table
Table can be removed by clicking “Remove”. All table connected below that table will also be deleted together from the canvas.
Move Table
Click on Move To, then your desired table to move.
Union, Joins, & Blend
#Join
Two ways to combine two different tables –
1 – Appending – vertically combining the data joining as rows
adding the table as extra rows.
vertically combining the data is called Union.
If column heading is same, then only we should join.
If there are mismatch of column heading, then it will be created as separate column as extra number of column.
Null value will be shown for the heading with no relevant value related to the table.
position of column doesn’t matter, but the matching of heading is important.
*********
2. –
How to join or append the data
double click on table after dragging to data source area.
then drag the second table to union and then leave it below (not to the right) the first table.
Once the union is done, it will show the hierarchy symbol to the left of the name of the table.
while dragging it will show “drag to union” below the first table.
We can rename the combined table to avoid confusion and not count it as single table.
If you drag the column or dimension with null value, it will show null value in the chart.
There are formulas to fill null values.
ZN(sales) – used for null value calculation (need to research futher)
Ifnull(brand,”no brand”)
************************************
Join
Different tables are kept separately to manage the memory.
All types of columns are not combined, because it will increase the size of the database with irrelevant values in the irrelavant column.
It is a little bit of data engineer concept, which should be known by the data scientist or data analyst.
example, age column may not be required in the transaction table. Whereas sale column is must in the transaction table.
The database or table should be also optimized in terms of size also. Unneccessary size increase should not be there.
We will use join to combine
There 4 types of Join
1. Left Join
2. Right Join
3. Inner Join
4. Outer Join
There are more types of joins, but those are not much used.
1. Left Join –
Bring all rows from left table, bring only matching rows from right table.
It is called left Join. It means full rows of left and only matching rows from the right table. unmatched rows will not be taken from right table.
2. Right Join – It is the inverse of left table.
all rows in the right table will be there(whether matched or not), all matched rows from the left table (unmatched will not be taken from left or skipped.)
***********
3. Inner Join
Only matching rows in both left and right will be shown.
unmatched rows from both table will not be shown.
Inner join will only shows common rows, common data. – common order id.
******************
Outer Join – everything included
combined all common and uncommon
combine all rows in left and right table, whether combined or not.
***************
Also, can we only find uncommon rows using the join?
we will need to apply filter on right and left join with Null.
It will pickup null value from both right and left table. and you can see the unmatched or uncommon value.
***********
Union is vertical adding and join is horizontal adding.
**********************************
full outer
How to join
Drag to the right of the 1st table after double click.
by default, tableau will show inner join means it will only show common rows. it can be changed according to our requirement such as left, right, full outer.
You can change the join type by clicking on it.
you can also match the heading manually, it can be used when there is spelling mistake such as product and prduct.
you can also add more matching heading which makes sense,
**************
color division in the bar can be changed by dragging the color from top to bottom in the legend. The info will be shown like that in the bar also, in that sequence.
**************
Join combine at row level,
Union combine at column level
*********
three table or multiple tables can also be joined
*******
Blend
it is used to combined data from different data sources such as excel, ms sql, oracle, saleforce etc.
difference b/w bledn vs join
1. blend aggregate first and then combine the data,
join combine the data first, then aggregate it.
2. join can’t combine two different data set.
******
How to blend
1. open the first file and drag the table
2. click on the cylinder symbol (new data source), then open 2nd file,
drag the desired table from 2nd table.
3. find the common heading and create connection by clicking on blend relationship from . (Click on Data – Edit Blend Relationship)
it can automaticly connect common heading. otherwise you can manually connect it.
once common dimension relationship is created, it will show chain symbol next to the dimension in the list.
Drag the common dimension from first table to the chart.
go to second table and select another dimension to chart.
************
primary will show in blue, secondary will show in orange color for file name. Also, in the rows/column shelf, secondary will show ass orange color.
**********
blend is by default – left join
there is no right join concept, we can only swap between primary and secondary table.
***********************
United States – USA
How to correct and match same item but with different name.
we can use alias.
#combined chart can’t be created using common dimension/measure.
#We can’t create two exact same alias. we can use formula, –
If (country) IN == ‘united states, ‘USA’,’United States of America’, then ‘usa’ end.
This can be used to clean the data, where there are more than 2-3 different names of usa, but we want to combine them and show as single value.
******************
Blending – First aggregate, then show in chart. 3 same order id will be combined and shown in 1 row.
Join – First combine and then aggregate in chart. 3 same order ids will be shown in 3 different rows.
#blend – it is used to do calculation from different data sources.
#ignore table calculation – table calculation will not be used.
*******************
Different data type source – blend
same data source type – join
Points to Remember:
- The first table dragged becomes the root table for other tables.
- It is always better to view the raw data source before connecting the table.
- Relationships can also be created using calculated fields.
- Note that deleting a table from the hierarchy will also delete all tables connected below it.
- Connecting field must have same data type.
dd